
The dashboard looks healthy. Green numbers. ROAS clearing the target. Cost per acquisition dropping month over month. The algorithm is doing exactly what you asked it to do — finding people who will buy within the next seven days and showing them your ad at the precise moment they’re about to convert.
You’re watching 40% of reality.
The other 60% — the part that drives pricing power, organic demand, and the kind of growth that compounds over years — doesn’t show up in any column of your Ads Manager. Not because it doesn’t exist. Because the system was built to ignore it.
The consensus is comfortable and wrong
The prevailing logic goes like this: digital advertising is the most measurable medium ever created. Unlike the old days of TV and billboards, you can trace every dollar to a conversion. Smart Bidding and Advantage+ find buyers faster and cheaper than any human media buyer could. The data doesn’t lie.
That logic is internally consistent. It’s also missing the majority of the picture.
Here’s why: Meta, Google, and TikTok don’t measure what advertising does. They measure what advertising does within an extremely narrow window of time. Meta’s default optimization runs on a 7-day click, 1-day view model. Google defaults to 30 days post-click. TikTok mirrors Meta at 7-day click, 1-day view. If a customer sees your brand campaign on Tuesday and buys six weeks later — which is how brand advertising actually works — the platform registers that exposure as worthless. Zero. The algorithm learns nothing from it and actively deprioritizes similar audiences going forward.
| Platform | Default Click Window | Default View Window | Max Available |
|---|---|---|---|
| Meta Ads | 7 days | 1 day | 28 days (reporting only—doesn’t affect optimization) |
| Google Ads | 30 days | 1 day | 90 days |
| TikTok Ads | 7 days | 1 day | 28 days |
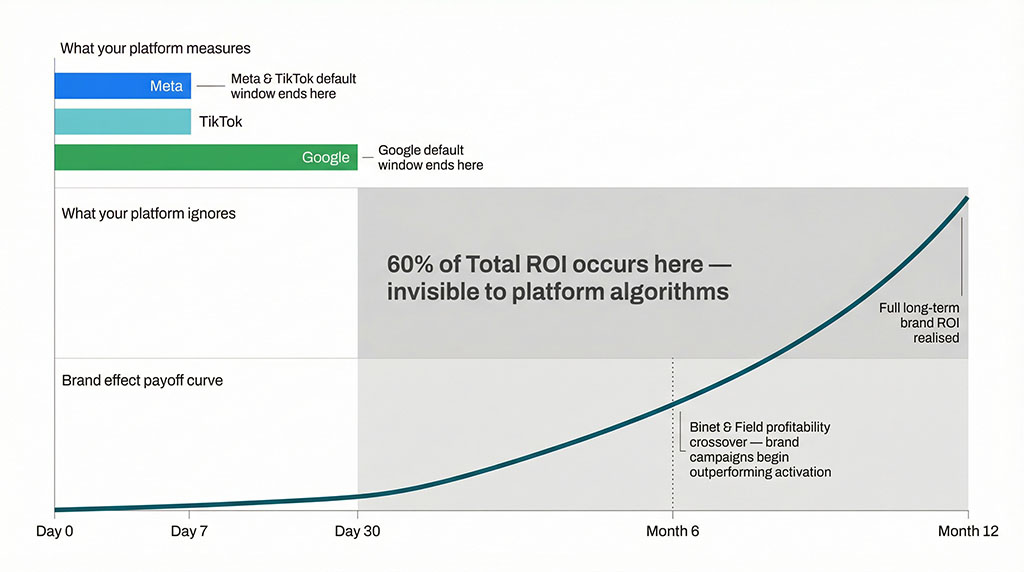
Now hold those numbers against this one: Meta’s own research with Nielsen, Nepa, and GfK — across 3,500 campaigns — found that long-term effects comprise almost 60% of Total ROI. The platform’s research division proved that most of the value happens after the platform’s optimization window closes. Their scientists know it. Their algorithm doesn’t care.
This isn’t a conspiracy. It’s an architectural mismatch. Platforms sell advertising on the basis of attributable conversions because that’s what’s easy to prove. Short-term ROAS is clean, precise, defensible in a board meeting. But the econometric reality — established across 996 case studies in Binet and Field’s analysis of the IPA Databank — is that brand building drives roughly double the long-term profit of activation-only campaigns. You just can’t see it in a 7-day window.
TikTok’s own internal data makes the undercount explicit: their 7-day default window misses 63% to 79% of actual conversions. A case study from 2026 showed an advertiser registering 23 conversions on default settings. Same budget, same creative, expanded to 28-day attribution — 87 conversions. The algorithm wasn’t finding fewer buyers. It was blind to three-quarters of them.
Adidas spent years optimizing for the wrong 35%
Between 2015 and 2019, Adidas ran the playbook every performance marketer would recognize. Heavy investment in bottom-funnel digital. Last-click attribution via Google AdWords. Every budget decision routed through ROAS dashboards. The numbers looked excellent — performance marketing appeared to drive the revenue, so the company kept shifting more budget toward performance and away from brand.
Then a technical breakdown halted their paid search across all of Latin America. According to every forecast model they had, this should have triggered an immediate, catastrophic drop in online sales. It didn’t. Traffic held steady. Revenue didn’t move.
The AdWords blackout revealed something the dashboard had been hiding for years: performance marketing was cannibalizing organic demand. It was intercepting people who already intended to buy — people primed by years of accumulated brand equity — and claiming credit for their purchases. The laser was taking credit for what the chandelier had built.
Adidas commissioned econometric modeling to quantify the damage. The findings were brutal: only 23% of their global marketing budget went to brand building, but that 23% was driving 65% of all sales — across wholesale, retail, and direct-to-consumer. The other 77% of budget, optimized relentlessly for short-term ROAS, was largely redundant.
You’ve been in this meeting. Someone presents the ROAS figures. Everything looks efficient. Nobody asks what would happen if the ads stopped running — because the dashboard doesn’t model that question. Adidas didn’t ask until the system accidentally answered it.
Their Global Media Director, Simon Peel, acknowledged it publicly: an obsession with granular ROI tracking had led the company to prioritize digital efficiency over actual business effectiveness. The performance metrics were precise. They were also measuring the wrong thing.
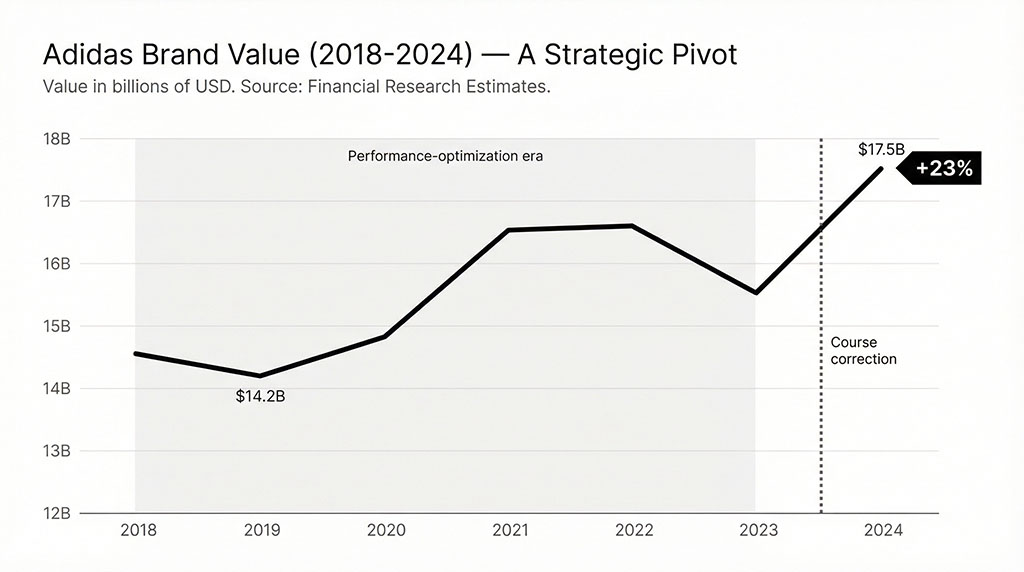
Adidas course-corrected to a 60/40 brand-to-activation split. They reintroduced television, out-of-home, and cinema — channels the performance dashboard couldn’t attribute but econometric modeling could measure. Brand value, stagnant between $14.2 billion and $16.6 billion during the performance years, surged 23% in 2024 to $17.5 billion. Their YouGov Brand Index score, flatlined for four years, jumped seven points in a single year — the highest recorded in a decade.
Airbnb proved it wasn't a fluke
If Adidas stumbled into the discovery, Airbnb turned it into doctrine.
Pre-pandemic, Airbnb was deep in the Silicon Valley growth playbook — overinvesting in search engine marketing and pay-per-click to chase measurable, short-term ROI. When COVID hit in 2020 and the company slashed performance spend to near zero, the same pattern emerged: traffic barely dropped. The brand was already doing the heavy lifting. The performance budget had been buying credit, not customers.
CEO Brian Chesky crystallized the insight in a comparison that deserves to be quoted in every CMO presentation for the next decade. Performance marketing, he said, is a laser — precise, targeted, but narrow and non-compounding. Brand marketing is a chandelier — it illuminates broadly and builds cumulative advantage over time.
Airbnb didn’t just trim performance spending. They permanently halved it relative to 2019 levels and redirected capital into brand campaigns, PR, and out-of-home across 22 global markets. The “Made Possible by Hosts” television campaign was brand building in its purest form — broad reach, emotional storytelling, zero calls-to-action.
The results broke every assumption the performance-marketing ecosystem holds dear. By spending 28% less on total marketing, Airbnb posted $1.9 billion in profit in 2023 — while gig-economy peers like Uber, DoorDash, and Pinterest continued hemorrhaging money buying growth through lower-funnel ads. Revenue hit $3.7 billion in Q3 2024, up 10% year-over-year.
The structural shift shows up most clearly in one metric: nearly 90% of Airbnb guests now arrive via the app or organic channels. They bypass the search engine entirely. Tracksuit data through December 2024 shows Airbnb commanding 86% brand awareness in the US travel accommodation category — matching Hilton, a company with a 115-year head start.
Airbnb didn’t achieve record profitability by finding a better 7-day algorithm. They achieved it by refusing to let a 7-day window define their strategy.
The promotional treadmill eats margins too
ASOS offers the cautionary parallel for brands that don’t course-correct in time. Trapped in a cycle of performance marketing and aggressive discounting to force short-term conversions, the British online retailer issued a profit warning in 2019 that cratered its share price by 40%. Pretax profits fell 68%. The executive team explicitly attributed the damage to “unprecedented levels of discounting” — the logical endpoint of a strategy where every budget dollar chases this week’s ROAS.
The broader fashion industry internalized the lesson. By late 2023, McKinsey surveys showed 71% of fashion executives planned to increase brand marketing spend — an industry-wide acknowledgment that performance algorithms alone can’t sustain a premium position or insulate a business from margin erosion.
"So I should turn off Smart Bidding?" No — you should stop asking it the wrong question.
Here’s the objection you’re already forming: this sounds like an argument for abandoning automated optimization and going back to manual campaign management. It isn’t.
The algorithm is extraordinary at what it does. The problem isn’t the machine. It’s the objective you’ve given it. When you run your entire budget through conversion-optimized campaigns, you’re asking the algorithm to find the 5% of your market that’s ready to buy right now. It will find them with terrifying precision. But it will never — structurally cannot — build the mental availability that turns the other 95% into future buyers. That’s not a bug. It’s a scope limitation disguised as a feature.
The fix is architectural, not tactical. You split the budget before the algorithm touches it.
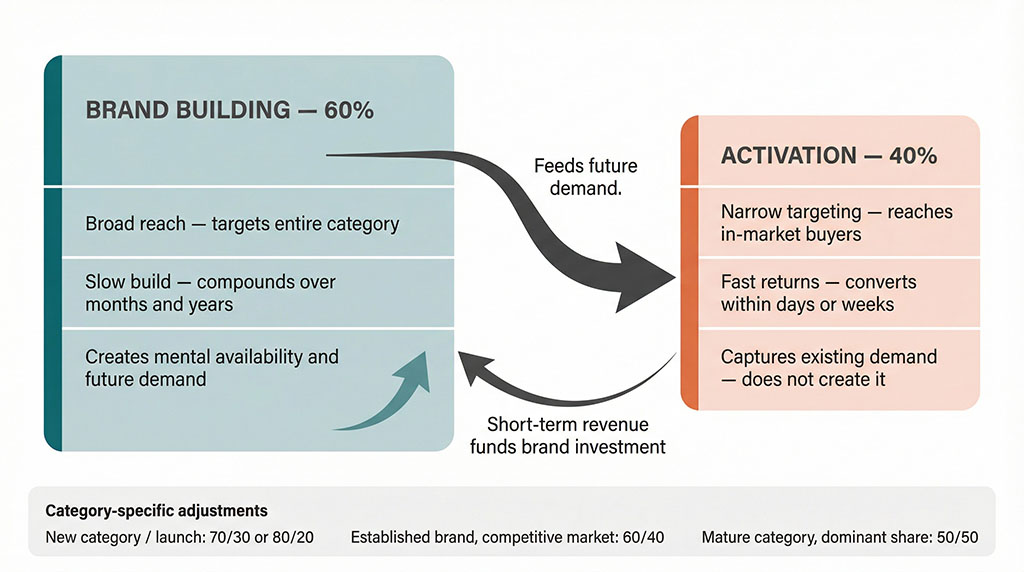
Binet and Field’s 60/40 framework — 60% brand building, 40% activation — is the starting point, not a rigid prescription. The research supports category-specific adjustments: e-commerce and DTC brands can shift toward 55:45 given their higher activation needs. B2B SaaS companies often benefit from 70:30 given longer sales cycles and the outsized role of trust. Mobile app businesses may operate at 50:50. Subscription models lean toward 65:35.
The structural requirements look different on each platform. On Meta, brand building means Reach and Video Views objectives with broad targeting and high-emotion creative — what their own research calls “4-5 Star Ads,” which deliver 2.5x higher awareness lift. Brand recognition needs to land within the first two seconds of video. On TikTok, it means always-on storytelling UGC (which their Dentsu research shows delivers 70% higher ROI than tactical content) through creator partnerships. On YouTube, it means long-form narrative content following the ABCDs framework — Attention, Branding, Connection, Direction — which delivers a 30% lift in short-term sales likelihood and a 17% lift in long-term brand contribution.
But the critical move happens before platform selection: protect the brand budget from the ROAS conversation. Brand campaigns measured on a 7-day window will always lose the budget meeting to performance campaigns. That’s not evidence that brand doesn’t work. It’s evidence that a 7-day measurement window can’t detect a 6-month payoff.
The dashboard hasn't changed. What you see in it should.
The green numbers are still there. The ROAS still clears the target. The algorithm is still doing precisely what you asked it to do — finding people who will convert within seven days and serving them an ad at the right moment.
But now you know what Adidas discovered when the ads accidentally stopped, what Airbnb proved when they intentionally cut them, and what every platform’s own research confirms: those green numbers represent less than half the story. The rest is playing out beyond the edge of the attribution window, in the slow accumulation of memory and trust and preference that no pixel can track and no 7-day optimization loop can value.
Your dashboard isn’t broken. It’s just measuring the wrong time horizon. The brands that figure that out first don’t just grow faster — they become the ones that everyone else’s algorithm is trying to intercept.
See what your attribution window is hiding
We’ll map your current platform spend against Binet & Field’s framework — and show you exactly how much of your ROI is falling outside your measurement window.
Most clients discover 40-60% of their budget is cannibalizing demand their brand already created. Takes 30 minutes.
Your dashboard isn’t broken. It’s just not showing you the whole picture.