
The analytics that cost Fortune 500s six figures? AI just put them in your price range.
Two dashboards. Two completely different stories. Then your email platform makes it three.
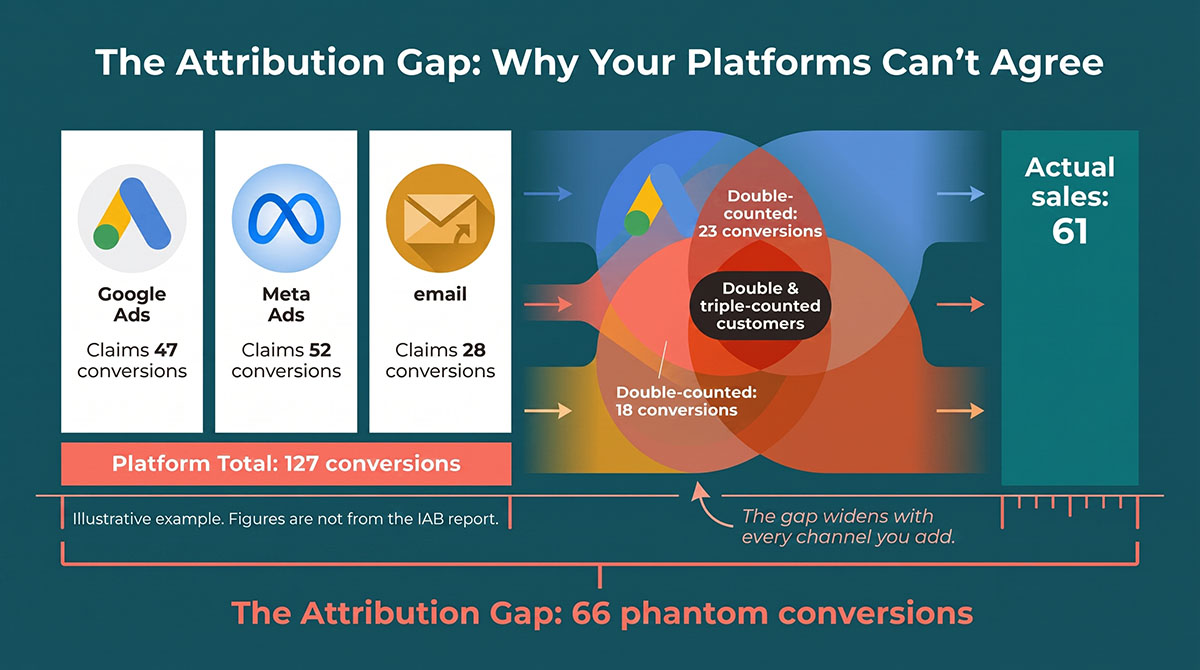
Google says last month’s campaign drove 47 conversions. Meta says it drove 52. Your email platform claims 28. That adds up to 127, and your actual sales were 61. You are staring at a screen doing arithmetic that will never reconcile, because all three are claiming credit for the same customers, and none of them will tell you which dollars actually produced the sale.
You have been here before. Every small business owner running paid ads has. You make the budget call on gut, hope the numbers sort themselves out, and quietly wonder how much you are lighting on fire each month.
You are not paranoid. The people running measurement at the biggest advertisers in the country just confirmed what you suspected.
The $32 billion confession
The IAB has published its State of Data 2026 report. It surveyed 430 planning and analytics decision-makers at U.S. brands and agencies. Worth knowing who these people are: 83% of them sit at VP level or below. These are the practitioners who run the measurement work every day, not the executives who sign off on the budget.
The findings are blunt. Among the people who use each method regularly, somewhere between 60% and 75% say it underperforms on the basics. Rigour and coverage. Timeliness. Trust and transparency. Operational efficiency, which is the polite way of saying the work does not fit in the time and headcount available. Attribution has 315 regular users in the sample. Incrementality has 292. Marketing mix modelling has 287. These are people with analytics headcount, paid measurement tools, and a job description that says nothing except work out which ads worked.
And they still cannot make the numbers agree.
The three approaches they rely on each answer a different question, and they rarely talk to each other. Attribution tells you which touchpoints preceded a sale. Incrementality tells you what would have happened if you had not advertised. Marketing mix modelling tells you how the whole portfolio behaves. Only 39% of the sample use all three together. The rest are allocating budget on partial information.
You know what that feels like at $5,000 a month. Imagine it at $5 million.
Here is where the report gets interesting for a business operating at your scale. The IAB asked planners what they would do if AI-enhanced marketing mix modelling became more accurate and more trusted. They said they would move an average of 5.6% more spend into channels that are currently underrepresented. That is stated intent, not measured behaviour, and the condition attached to it is narrow. Not AI in general. AI-enhanced marketing mix modelling specifically.
The IAB then applied that 5.6% to U.S. market spend levels and arrived at $26.3 billion in redirected media investment, plus $6.2 billion in recovered planner time. Call it $32 billion. Both halves are extrapolations built on what planners say they would do, so treat the number as a signal of direction rather than a forecast. It is also not new money. It is money already being spent, just spent in the wrong places because the measurement could not keep up.
The same correction that is coming for Nike and Procter & Gamble is coming for your ad account.
The channels you depend on are the ones nobody can measure
Here is the data point buried in the report that should matter most to you.
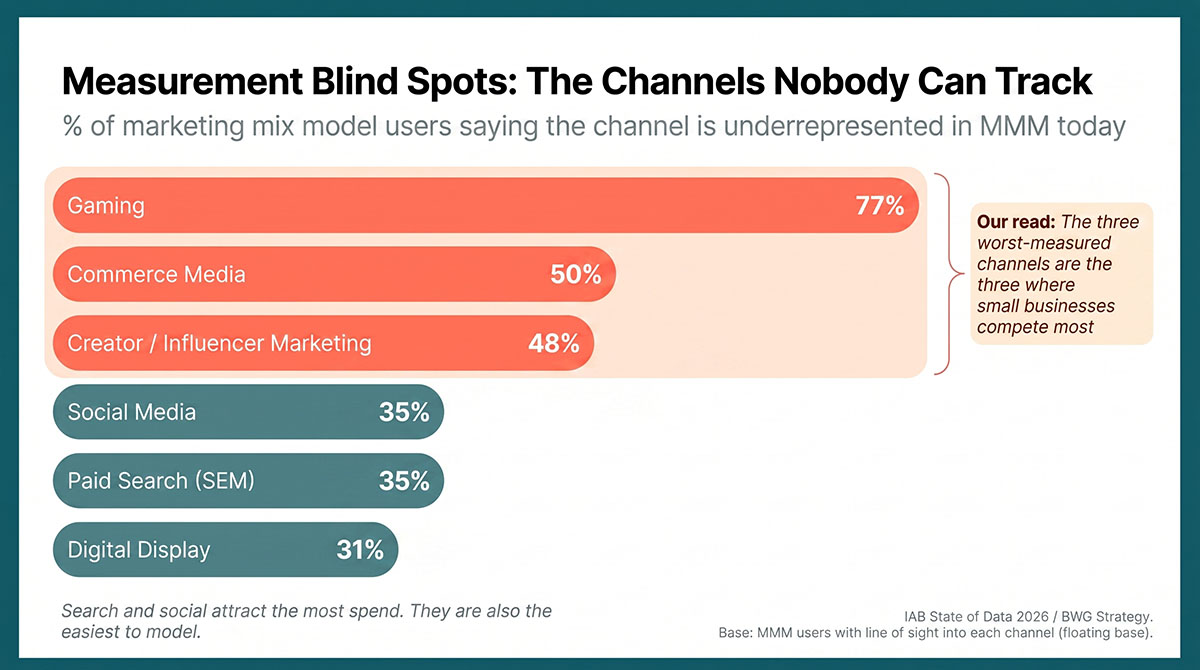
The IAB asked which media channels are underrepresented in marketing mix models today. Marketing mix models specifically, not measurement in general, answered by the people who use them and can see each channel.
Gaming topped the list at 77%. Commerce media, meaning Amazon and the retail networks, came in at 50%. Creator and influencer marketing came in at 48%. Other traditional media, which the report defines as radio, print, out-of-home and direct mail, sat at 46%. Digital out-of-home is counted separately at 43%, connected TV at 41%, and linear broadcast and cable at 38%.
Read that list again. Those are not the channels Fortune 500 brands care most about. Those are the channels you care about. Small businesses lean disproportionately on creator partnerships, Amazon storefronts, TikTok Shop, and niche platforms where the measurement infrastructure was never built.
Spend, meanwhile, keeps concentrating in search, display and social, which happen to be the channels where measurement works best. The report does not claim one causes the other, and I am not going to pretend it does. But the models carry a built-in bias toward what is easy to count, and budget follows the count.
Think about what that means for your business. You run influencer campaigns and watch sales move, but you cannot prove the connection in a dashboard. You sell through Amazon and your mix model, if you have one at all, treats that channel as a rounding error. You decide where next quarter’s money goes based on the channels that are easiest to measure, not the channels working hardest.
That is the same $32 billion problem at your scale.
What AI actually changes (and what it doesn't)
The report tracks a real shift in how AI is being applied to ad measurement. Today it mostly does the grunt work. Among planning roles, data preparation eats 42% of the time spent on advanced measurement tasks. Insights and strategy get 32%. Model maintenance gets 20%. That 42% is a slice of the measurement work, not a slice of the whole job, and the report labels it only as data preparation.
Within the next one to two years, the buy side expects AI to move into harder territory. Designing test structures. Matching ad exposures to actual outcomes. Tuning the models themselves. That is the work that used to require a team of data scientists and six months of runway.
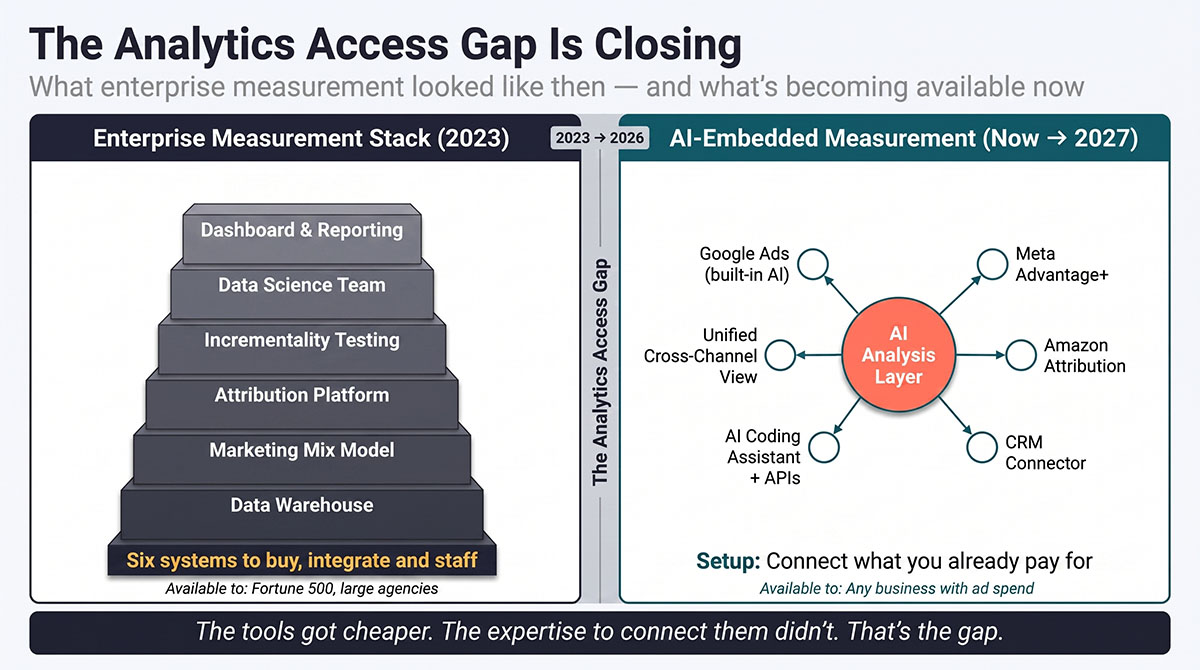
Some practitioners are not waiting for that timeline, because the tools already exist. AI coding assistants connect directly to your ad platforms, your CRM, your analytics suite and your sales data through API connectors. Live data from Google Ads, Meta, Salesforce, HubSpot and a dozen other sources lands in a single analysis environment. From there, predefined analytical frameworks do the work automatically. Matching search intent to lead quality. Tying ad exposures to closed revenue. Separating the campaigns that produced pipeline from the ones that produced clicks and nothing else.
The mechanics are surprisingly accessible. It is a tool sitting on a desktop. The hard part, and the part that still needs a human, is the intellectual architecture underneath. Knowing which data sources to stitch together. Knowing which questions to ask. Knowing how to sequence the analysis so the output is worth trusting. The AI is the engine. The wiring diagram is the IP.
That distinction creates what you might call the Analytics Access Gap. It is the space between the tools existing and someone knowing how to use them. The cost of the engine just dropped to near zero. The cost of the expertise did not. That gap is where most small businesses are about to get stuck.
For large organisations, the change is speed. The report expects AI to move attribution and marketing mix modelling from annual or twice-yearly runs to monthly ones, and to lift incrementality testing from three to five tests a year to eleven or more. The starting point is not as slow as you might assume. Among marketing mix model users, 21% refresh annually and 33% refresh twice a year, but 25% are already quarterly and 14% run monthly or more often. An annual model tells you what worked last year. A monthly model tells you what is working now, while you can still do something about it.
For small businesses, the change is more fundamental. You were never going to hire a data science team. You were never going to build a marketing mix model from scratch. Cost and complexity put enterprise-grade measurement out of reach entirely.
That barrier is coming down, though not as neatly as one headline number suggests. Some 83% of planning teams already reach for general-purpose AI tools in their measurement work. The IAB does not offer that as proof the approach works. It offers it as a limitation. Those tools are easy to get hold of and they lack the functionality to scale across serious measurement workflows. Which is exactly where you are standing. You can open the same tools an enterprise planner opens. Getting them to produce measurement that holds up is a different problem, and it is the problem worth solving.
The gap between what Nike knows about their ad performance and what you know about yours is narrowing for the first time. Not because the tools got incrementally better. Because the architecture changed.
"Great, but I run a 12-person company"
Let’s pause, because you are reading about enterprise brands and major agencies. The $32 billion figure comes from a conference room you will never enter. Marketing mix models? Incrementality tests? You are trying to work out whether the next $500 goes into Instagram Reels or Google Search.
That scepticism is earned. Most measurement research treats small businesses as an afterthought.
The reason this shift matters to you is that the tools are not staying behind enterprise paywalls.
The same AI capabilities helping an analytics team at Unilever tune a mix model are turning up inside Google’s Performance Max, inside Meta’s Advantage+ campaigns, inside Amazon’s attribution tools. The sophistication is being built into platforms you already use, at prices you already pay.
Consider the 69% of analytics teams who describe themselves as scaling AI deployment. That is a self-reported stage on a four-point maturity ladder rather than proof of production-scale AI, and it applies to analytics roles specifically. Across all roles in the survey the figure is closer to half. Either way, those teams are building the infrastructure your self-serve tools will run on. And the 44% of analytics teams using AI agent platforms today? Those agents are being packaged up for the rest of the market.
You do not need to build the system. You need to be ready to use it.
Three things to do before the tools arrive
The report gives enterprises a long list. Governance frameworks, cross-functional working groups, data taxonomy standardisation. You need almost none of it. Three things will decide whether you catch this or miss it.
Get your tracking clean now. AI measurement tools are only as good as the data they ingest. If your conversion tracking is broken, your UTM parameters are inconsistent, or your CRM does not connect to your ad platforms, no amount of AI will save you. Spend the time now making sure Google Analytics, your Meta pixel, your email platform and your point-of-sale system all count the same event the same way. This is unsexy work that pays compound interest.
Start tracking the channels you have been ignoring. The IAB data is clear that the channels modelled worst today are the ones most likely to be undervalued. If you run influencer campaigns, start building even rough tracking. Unique discount codes. Dedicated landing pages. Sales lift measured against the weeks either side of the campaign. When AI-powered tools mature enough to model these channels properly, they will need history to feed on. The owners capturing that history now will start 12 to 18 months ahead.
Question your platform’s self-reported numbers. Every ad platform grades its own homework. Google will always tell you Google works. Meta will always tell you Meta works. In the IAB survey, 72% of the people who use attribution regularly say it does not capture cross-channel performance well. As independent cross-platform views arrive, the businesses that already treat self-reported metrics with suspicion will adapt faster than the ones taking them at face value.
Back to those three dashboards
Google still says 47. Meta still says 52. Your email platform still says 28. Your actual sales are still 61.
The gap between what you can see and what is actually happening is about to shrink. Not because you are hiring a data science team, but because the same AI restructuring measurement for the largest advertisers in the world is being pushed down into the tools already open on your laptop.
The IAB’s $32 billion figure describes misallocated spend across an entire industry. Your version of that number is smaller. A few hundred here, a few thousand there, spent on the wrong channels because you could not see what was working.
The tools to see it are arriving. The Analytics Access Gap, which is simply knowing how to wire them together, is the only thing standing between you and the view Fortune 500 brands have had for years.
For the first time, that gap is closeable.
Your marketing, looked at properly
Thirty minutes on your current setup — what’s working, what’s quietly leaking budget, and what I’d fix first. You’ll leave with a clearer picture whether we work together or not.
Got something specific bugging you? Flag it when you book and I’ll have it looked at before we talk.
Data and findings referenced in this article are from the IAB State of Data 2026: The AI-Powered Measurement Transformation report, published February 2026 in partnership with BWG Global. The study surveyed 400+ senior planning and analytics decision-makers at U.S. brands and agencies.

AboutBruce Marjoribanks
Bruce Marjoribanks has spent 27 years in marketing, including building, running and selling his own agency before going independent. He now runs every channel - paid, organic, social, email, creative and automation - as one integrated system, with AI ehancing production and the judgment staying human.