
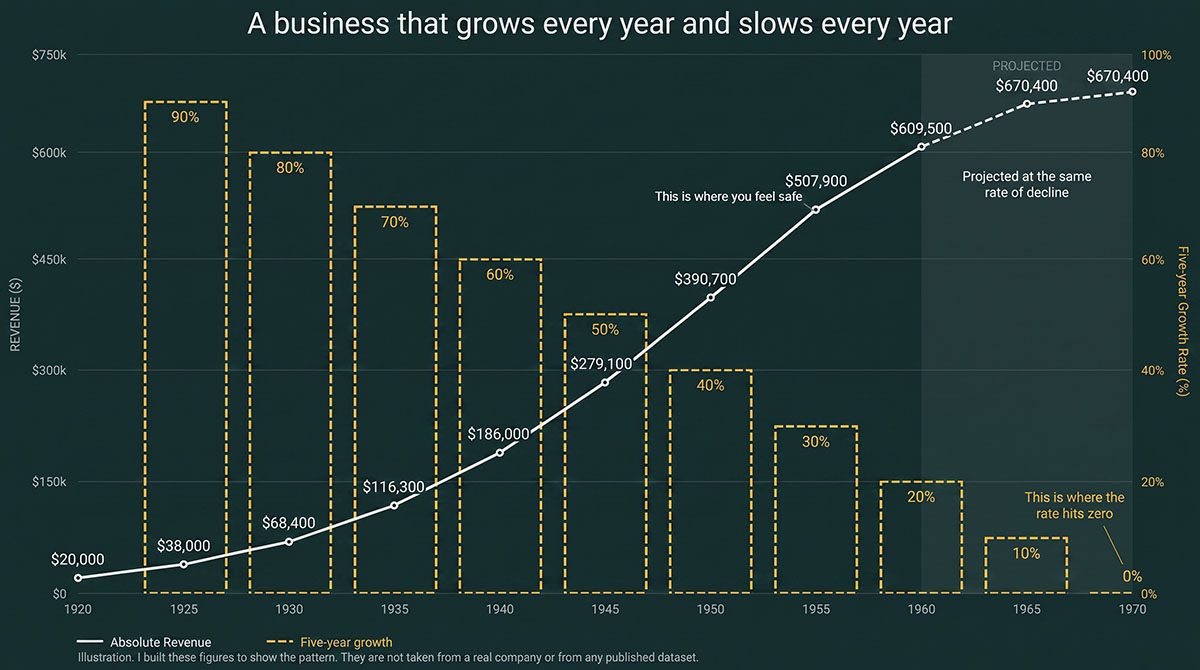
Here is a company that never existed. I built it to make one point, so treat the numbers as an illustration and nothing more. The shape is the part that is real.
It opens in 1920 doing $20,000 a year. Forty years later it is doing a little over $600,000. Every five-year period has grown. Not one has gone backwards. The owner looks at the line on the wall and feels what any reasonable person would feel.
Safe.
Now look at the number underneath the line. In its first five years the business grew 90%. The next five, 80%. Then 70, 60, 50, 40, 30, and 20. Revenue climbed the whole way. Growth velocity fell ten points every single period, without exception.
Run that forward and you do not get a crash. You get a flat line. By 1965 the growth is 10%. By 1970 there is none. The business does not fail. It stops going anywhere, and it looks healthy right up to the moment it does.
I want to be exact about where this idea comes from, because it is borrowed, and it is borrowed twice over.
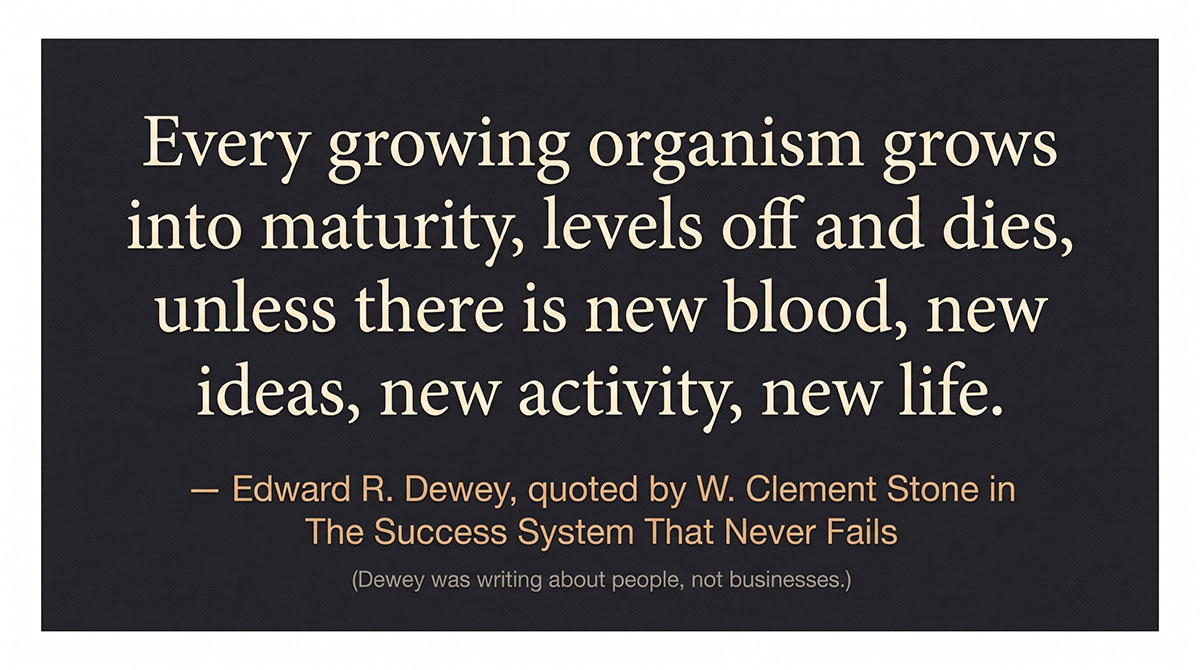
The economist Edward R. Dewey wrote that every growing organism grows into maturity, levels off and dies, unless there is new blood, new ideas, new activity, new life. W. Clement Stone quotes that line in The Success System That Never Fails. Stone is using it to talk about people. His argument is that someone who stops being dissatisfied with their own results stops improving, and he wants you to stay uncomfortable enough to keep going.
Neither man was writing about marketing. Dewey studied economic cycles. Stone was writing about motivation. I am taking the shape of what they said and pointing it at something they never mentioned, which is the marketing engine inside a business. The chart above is mine and the argument that follows is mine. Borrow the picture from them, not the authority.
The picture holds up on its own. The revenue is up. The rate is down. And nobody can see it, because nobody is looking at the number that would show it.
The Number Your Marketing Dashboard Is Not Showing You
Most small business owners watch revenue. Some watch leads. Fewer watch conversion rates. Almost none watch rate of growth, which is the change in the change. It is the velocity behind the number, and it tells you whether your marketing is building momentum or quietly losing it.
The calculation is not complicated. Take your new customer acquisition this quarter. Compare it to the same quarter last year. Now compare that growth rate to the rate from the year before. Is the rate itself growing, holding, or falling?
If you cannot answer that in thirty seconds, you do not have a growth problem yet. You have a visibility problem. Visibility problems become growth problems on a schedule you do not control.
The owner in my illustration could not see it either. He was reading the wrong number, absolute revenue instead of growth velocity, and the chart on his wall made the wrong number look like the right one. A rising line feels like safety. It is not always.
Why Your Marketing Setup Is Built to Hide This
Here is where it gets specific, and where I have watched the same pattern repeat across clients in home services, professional practices and e-commerce.
A fragmented marketing setup does not just fail to show you a falling growth rate. It is built in a way that hides it.
Your Google Ads manager sends you a report. Impressions up. Click-through rate up. Conversions attributed to search, up. Good news.
Your Facebook freelancer sends you a report. Reach up. Engagement up. Lead volume from social, steady. Holding.
Your email marketer sends you a report. Open rates improving. Click rates solid. Revenue attributed to email, up month on month.
Three reports. Three sets of good news. Nobody lying. And somewhere in the gap between the three dashboards, the rate at which your business wins new customers at a cost you can sustain is falling, quarter by quarter, while everyone shows you their own wins.
This is attribution blindness. It is not fraud and it is not incompetence. It is a structural failure. When each channel reports its own performance on its own, nobody ever has to report what the system is doing. The system is the only place rate of growth lives.
The Objection That Sounds Right
You might be thinking: I track my numbers. I would see a slowdown coming.
Maybe. If you are watching the right number, and if the signal is strong enough to get through three separate dashboards running three separate attribution models, all claiming credit for the same customers.
Here is what a falling growth rate looks like in practice. It does not arrive as a crisis. It arrives as a slight softening. Leads are a little harder to convert this quarter. Cost per acquisition is a little higher. The campaign that carried you eighteen months ago now returns half as much and still runs, because nobody owns the decision to switch it off. Each agency sees their piece. Nobody sees the pattern.
In the accounts I have gone through, the rate had usually been sliding for a year or more before the revenue line showed anything at all. That is what I have seen in my own work rather than a finding from a study, so take it as a warning and not a rule. The point survives either way. Revenue reports the problem late. The rate reports it early.
The Second Way Fragmentation Hides It
Attribution blindness is the diagnostic failure. There is a second mechanism running underneath it, slower and harder to see.
Brand dilution.
When three separate agencies produce your marketing, each with their own creative approach, their own copywriting instincts and their own version of what your business is and who it is for, your customers receive three different versions of you. The Google ad looks different from the Facebook creative. The Facebook creative sounds different from the email. The landing page was written by someone who has not seen the ads running to it in four months.
On its own, none of that looks serious. Added up, it erodes the one thing that makes marketing compound instead of reset, which is recognition. Every impression that lands on someone who does not immediately connect it to your business is a partial impression. Awareness that does not stack. Multiply that across thousands of contacts over months and you get the shape Dewey described. Not collapse. Deceleration. The slow unwinding of momentum you built when your message was sharper and your channels were fewer.
New life, in this context, is not a bigger ad budget. It is coherence. One message, one voice, one visual identity, across every channel your customer touches. Coherence compounds. Fragmentation does not.
Same business, three agencies' interpretations
Google Display Ad
Meridian Growth
Meridian Growth — Strategic Advisory for Scaling Businesses
Expert guidance to help your business reach the next stage. Trusted by 200+ founders.
Learn More
#4A7C8A
Source Sans · 300
Logo: top left
Facebook Ad Creative
Ready to Scale?
We'll Get You There.
We'll Get You There.
Growth isn't luck — it's strategy. Join 200+ founders who chose Meridian.
Get Started
MERIDIAN
#3D8A7A
DM Sans · 700
Logo: bottom right
Email Header
MERIDIAN GROWTH
Smart Scaling Starts With the Right Partner
Trusted advisory for ambitious businesses ready for their next chapter.
Book a Consultation
#5A8E8A
Nunito Sans · 600
Logo: centred
Three agencies. Three briefs. One customer trying to recognise you.
Meridian Growth is invented. The ads are mockups built to show the effect.
What One System Actually Diagnoses
The reason I keep coming back to this idea is that it changes what an integrated marketing system is for.
Most of the conversation about consolidating agencies is about efficiency. Fewer briefings, less coordination, lower cost. That is real and I have written about it elsewhere. The deeper value is diagnostic.
When one system owns every channel, Google, Meta, LinkedIn, email, landing pages and attribution, and every piece of data lands in the same dashboard, rate of growth becomes visible for the first time. Not as three channel metrics that each look fine, but as one system metric that shows you what your marketing is doing to the direction your business is travelling.
I have run Waste Audits where the owner was genuinely surprised by the consolidated view. Not because the individual channel reports were wrong. Because each report was accurate and still hid a pattern that only exists at the system level. New customer acquisition rate falling 12% year on year for two years. Cost per acquisition up 18% over the same period. Brand search volume flat while paid volume grew, which is one of the better signs that paid activity is renting attention rather than building a brand.
Those figures come from my own audits of my own clients. Nobody has checked them but me, and I am also the person selling the fix, so weigh them accordingly. What I can tell you is that none of it appeared in a channel report and all of it appeared in one system.
The way out of a falling growth rate is to introduce something new before the momentum stops. You cannot introduce something new to fix a problem you cannot see.
What fragmented reporting shows
Google Ads
Good
Impressions
↑ 24%
CTR
↑ 3.2%
Conversions
↑ 18%
Meta Ads
Holding
Reach
↑ 31%
Engagement
↑ 2.8%
Leads
Steady
Email
Good
Open Rate
↑ 28%
Click Rate
↑ 4.1%
Revenue
↑ 12%
Three reports. Three sets of good news. No pattern.
What one system shows
New Customer Acquisition Rate
Declining
↓ 12%
Year on year. Fewer new customers despite higher spend
Cost-per-Acquisition Trend
Rising
↑ 18%
Over 24 months. Each customer costs more to win
Brand Search vs Paid Volume
Paid outpacing organic
Flat vs ↑
Organic demand static while paid dependency grows
System-Level Growth Velocity
Decelerating
The dashed line. Momentum fading while channels report green
The data was always there. The system makes it visible.
Figures from one Untapped Profits client audit. First-party data.
The Second Question
Go back to the chart. Forty years of rising revenue. A line that gains in every single period. An owner in 1960 with every reason to feel confident.
The first question is easy. Is your revenue growing? The second one is the one that decides things. Is your rate growing, holding, or falling, and do you know which one it is right now?
Most owners I speak to answer the first immediately. Very few answer the second without pausing. Almost none can answer it broken down by channel, by customer segment, by campaign, which is the resolution where you can actually do something with what you find.
That is not a discipline failure. It is a system failure. The setup they are running was never built to show them that number. It was built so each agency could show them a different number that made that agency look good.
The owner in the illustration had every reason to feel fine right up to 1965. He was reading the solid line. The dashed one was the one that mattered.
The Waste Audit I run in thirty minutes is not a sales conversation. It is the dashed line. Your system’s real growth velocity, where it is heading, and what the integrated view shows that your current dashboards do not.
What year are you on?
Your marketing, looked at properly
Thirty minutes on your current setup — what’s working, what’s quietly leaking budget, and what I’d fix first. You’ll leave with a clearer picture whether we work together or not.
Got something specific bugging you? Flag it when you book and I’ll have it looked at before we talk.

AboutBruce Marjoribanks
Bruce Marjoribanks has spent 27 years in marketing, including building, running and selling his own agency before going independent. He now runs every channel - paid, organic, social, email, creative and automation - as one integrated system, with AI ehancing production and the judgment staying human.